Podledger Documentation
Welcome to the Podledger documentation. Here you'll find everything you need to get started with Kubernetes cost monitoring and optimization.
Quick Start
Want to get up and running fast? Jump to the Quickstart guide to deploy Podledger in under 5 minutes.
What is Podledger?
Podledger is a Kubernetes cost intelligence platform built around two core services: a Data Uploader that collects cluster metadata and usage snapshots, and a central Ingester that enriches data with cloud pricing and stores cost analytics in PostgreSQL/TimescaleDB. It provides:
- Metadata & usage collection: Watches Nodes, Pods, PVs, PVCs and LoadBalancer resources in near real-time
- Multi-cloud support: Uploads snapshots to Azure Blob Storage, AWS S3, GCS or local storage
- Metrics collection: CPU, Memory and optional GPU usage from Metrics Server or Prometheus
- Centralized ingestion: Pricing enrichment, cost snapshots and TimescaleDB-ready storage
Quickstart
Deploy both the Data Uploader and Ingester components for a complete Podledger installation.
Get Podledger running using the uploader/ingester architecture.
Step 1: Deploy Data Uploader
helm upgrade --install podledger-uploader ./deploy --set clusterName=my-cluster --set tenantId=my-tenant --set cloudProvider=azureStep 2: Deploy Ingester
helm upgrade --install podledger-ingester ./deploy --set config.cloudProvider=azureStep 3: Verify Health
kubectl get pods -A | grep podledger
curl http://localhost:8080/health
Step 1: Add the Helm Repository
helm repo add podledger https://charts.podledger.com
helm repo update
Step 2: Install Podledger
kubectl create namespace podledger

helm install podledger podledger/podledger \
  --namespace podledger \
  --set cloudProvider=aws \
  --set dashboard.enabled=true
Step 3: Access the Dashboard
# Port-forward to access the dashboard
kubectl port-forward -n podledger svc/podledger-dashboard 8080:80

# Open in your browser
open http://localhost:8080
That's it! You should now see the Podledger dashboard with real-time cost data from your cluster.
Architecture
Podledger runs as a set of lightweight components inside your Kubernetes cluster:
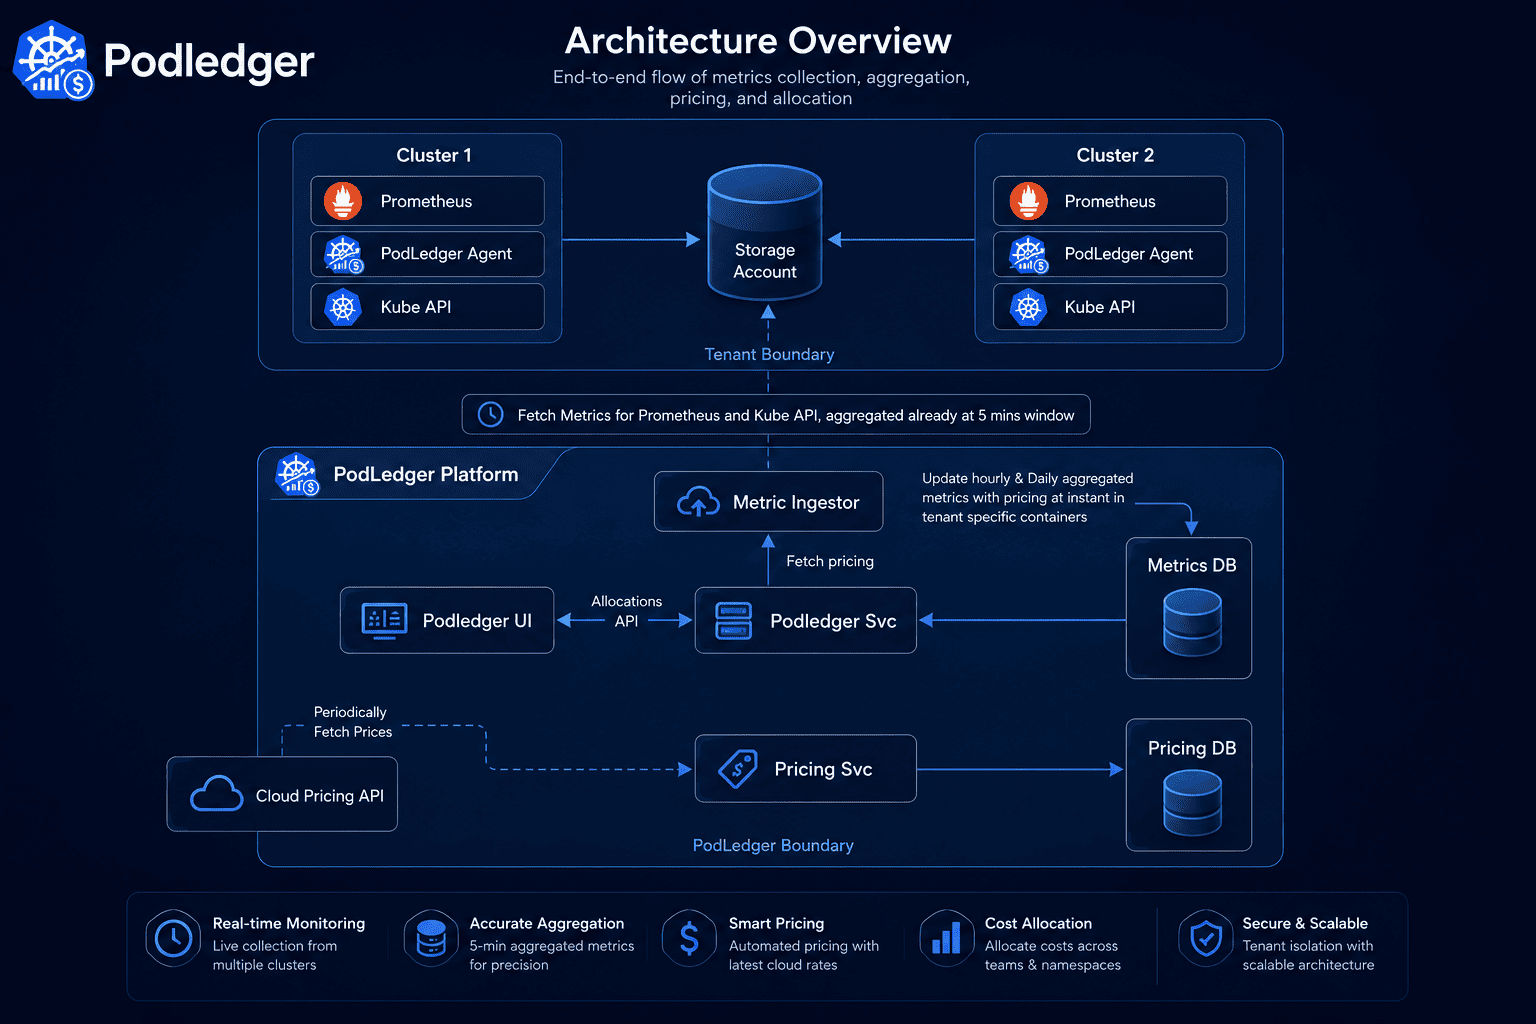
- Data Uploader: Watches Kubernetes resources, performs reconciliation, collects metrics and uploads epoch snapshots
- Ingester: Discovers cloud objects, processes metadata, syncs pricing catalogs and generates cost snapshots
- Storage Layer: PostgreSQL/TimescaleDB schema for metadata, usage and cost analytics
- Cloud Storage Contract: Metadata and metrics stored by epoch under tenant/cluster prefixes
Prerequisites
Before installing Podledger, ensure you have:
- Kubernetes cluster v1.23 or higher
- Helm v3.8 or higher
kubectlconfigured and connected to your cluster- Cluster-admin or equivalent RBAC permissions for installation
- Prometheus (optional — for enhanced metrics collection)
Supported Cloud Providers
EKS, EC2, Spot
GKE, GCE
AKS, VMs
Helm Installation
The recommended way to install Podledger is via our official Helm chart.
Basic Installation
helm install podledger podledger/podledger \
  --namespace podledger \
  --create-namespace
Custom Values
Create a values.yaml file to customize your installation:
# values.yaml
cloudProvider: aws  # aws | gcp | azure

collector:
  resources:
    requests:
      cpu: 50m
      memory: 128Mi
    limits:
      cpu: 200m
      memory: 512Mi

dashboard:
  enabled: true
  ingress:
    enabled: false
    # host: podledger.example.com

aggregator:
  retentionDays: 30
  aggregationInterval: 5m
helm install podledger podledger/podledger \
--namespace podledger \
--create-namespace \
-f values.yamlConfiguration
Podledger can be configured through Helm values, environment variables, or a ConfigMap.
Key Configuration Options
Upgrading
To upgrade Podledger to the latest version:
helm repo update
helm upgrade podledger podledger/podledger \
  --namespace podledger \
  -f values.yaml
Podledger upgrades are designed to be zero-downtime. Your historical cost data is preserved across upgrades.
RBAC & Permissions
Podledger follows the principle of least privilege. It requires only read access to cluster resources:
# Podledger ClusterRole (created automatically by Helm)
apiVersion: rbac.authorization.k8s.io/v1
kind: ClusterRole
metadata:
  name: podledger-reader
rules:
  - apiGroups: [""]
    resources: ["pods", "nodes", "namespaces", "services"]
    verbs: ["get", "list", "watch"]
  - apiGroups: ["apps"]
    resources: ["deployments", "replicasets", "statefulsets", "daemonsets"]
    verbs: ["get", "list", "watch"]
  - apiGroups: ["metrics.k8s.io"]
    resources: ["pods", "nodes"]
    verbs: ["get", "list"]
No write permissions are required for the Community Edition. The Autonomous tier requires additional permissions for applying optimization changes.
Multi-Cluster Setup
Multi-cluster support is available in the Autonomous tier. To monitor multiple clusters:
- Install the Podledger collector in each cluster
- Configure the central aggregator to receive data from all collectors
- Access the unified dashboard for cross-cluster visibility
# Collector configuration for remote cluster
helm install podledger-collector podledger/podledger \
  --namespace podledger \
  --set mode=collector \
  --set aggregator.endpoint=https://aggregator.podledger.example.com
Cloud Provider Integration
Podledger integrates with cloud provider billing APIs to correlate Kubernetes resource usage with actual cloud costs.
AWS Setup
# Create an IAM role with Cost Explorer read access
# Then configure in values.yaml:
cloudProvider: aws
aws:
  region: us-east-1
  costExplorer:
    enabled: true
    roleArn: arn:aws:iam::123456789:role/podledger-cost-reader
GCP Setup
cloudProvider: gcp
gcp:
  projectId: my-project-id
  billingExport:
    enabled: true
    bigQueryDataset: billing_export
Common Issues
Collector pods not starting
Check that RBAC is correctly configured and the service account has the required permissions:
kubectl get clusterrolebinding | grep podledger
kubectl describe pod -n podledger -l app=podledger-collector
Dashboard shows no data
Verify the collector is running and sending data:
kubectl logs -n podledger -l app=podledger-collector --tail=50
kubectl get pods -n podledger
High memory usage
For large clusters (100+ nodes), increase collector memory limits:
collector:
  resources:
    limits:
      memory: 1Gi
Viewing Logs
# Collector logs
kubectl logs -n podledger -l app=podledger-collector -f

# Aggregator logs
kubectl logs -n podledger -l app=podledger-aggregator -f

# Dashboard logs
kubectl logs -n podledger -l app=podledger-dashboard -f
Enable debug logging by setting logLevel: debug in your values.yaml.